Designed and built by PRS CloudTech How we built Waybridge Get an app like this
For parcel and courier operations rooms

Control tower for parcel hubs, exceptions and delays

A live map of hubs and parcels, a list of stuck parcels, hourly hub charts and delay alerts that warn before a delivery promise is broken.

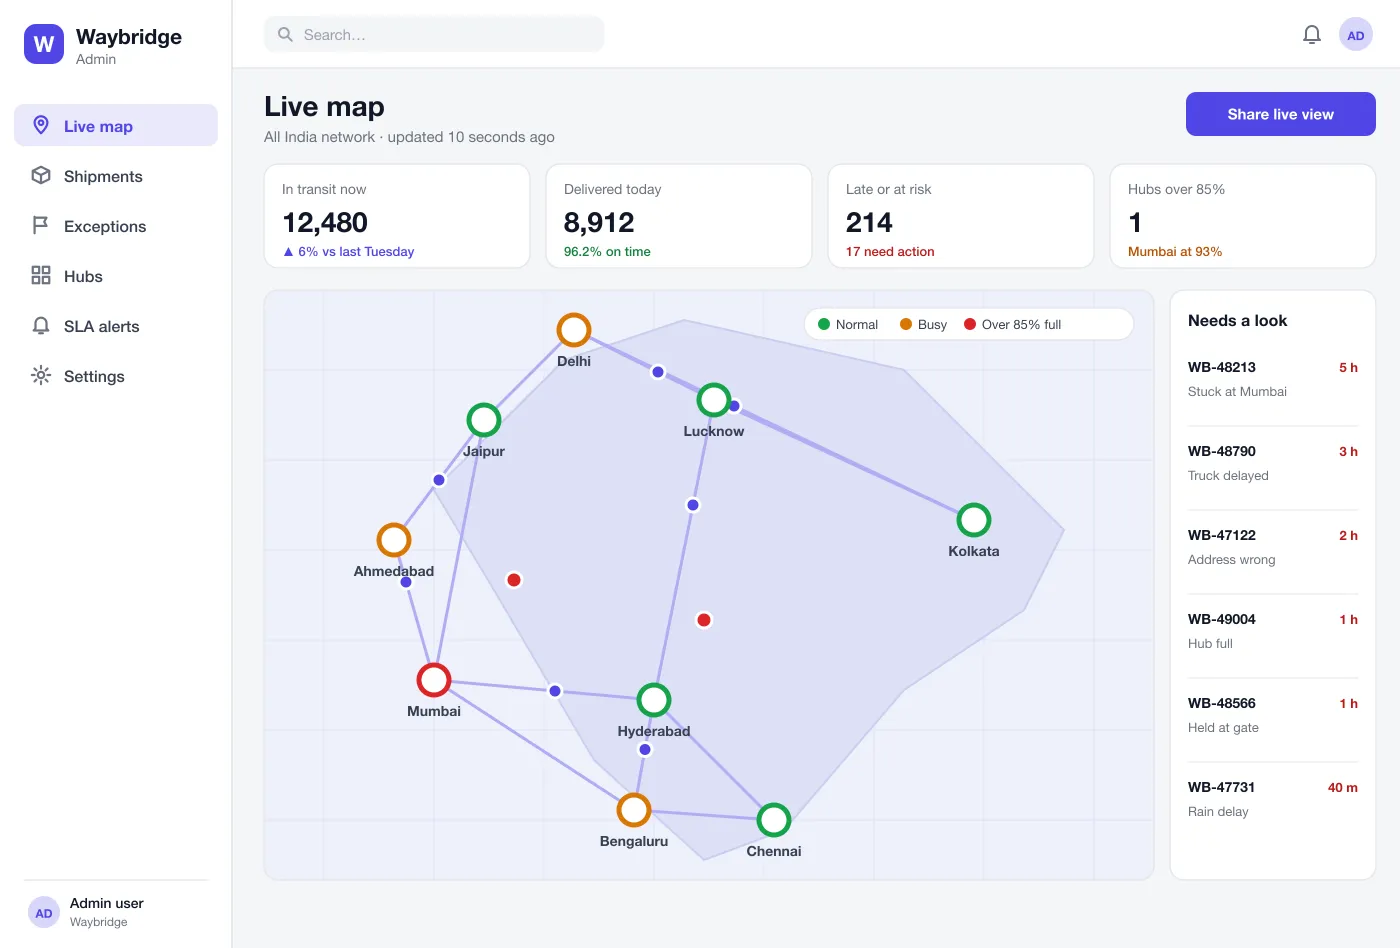
Live map: every hub and the parcels moving between them right now
Live hub mapHubs show how full they are, and moving parcels show on the lanes.
Stuck parcel listParcels that break a rule wait here, with how long they have been stuck.
1app
3user roles
9hubs on the map
The screens

Four views. One operations room.

01 / 04

Live map

Every hub sits on the map as a circle coloured by how full it is. Parcels move as dots along the lanes, and a side list shows what needs a look first.

Live map: every hub and the parcels moving between them right now
02 / 04

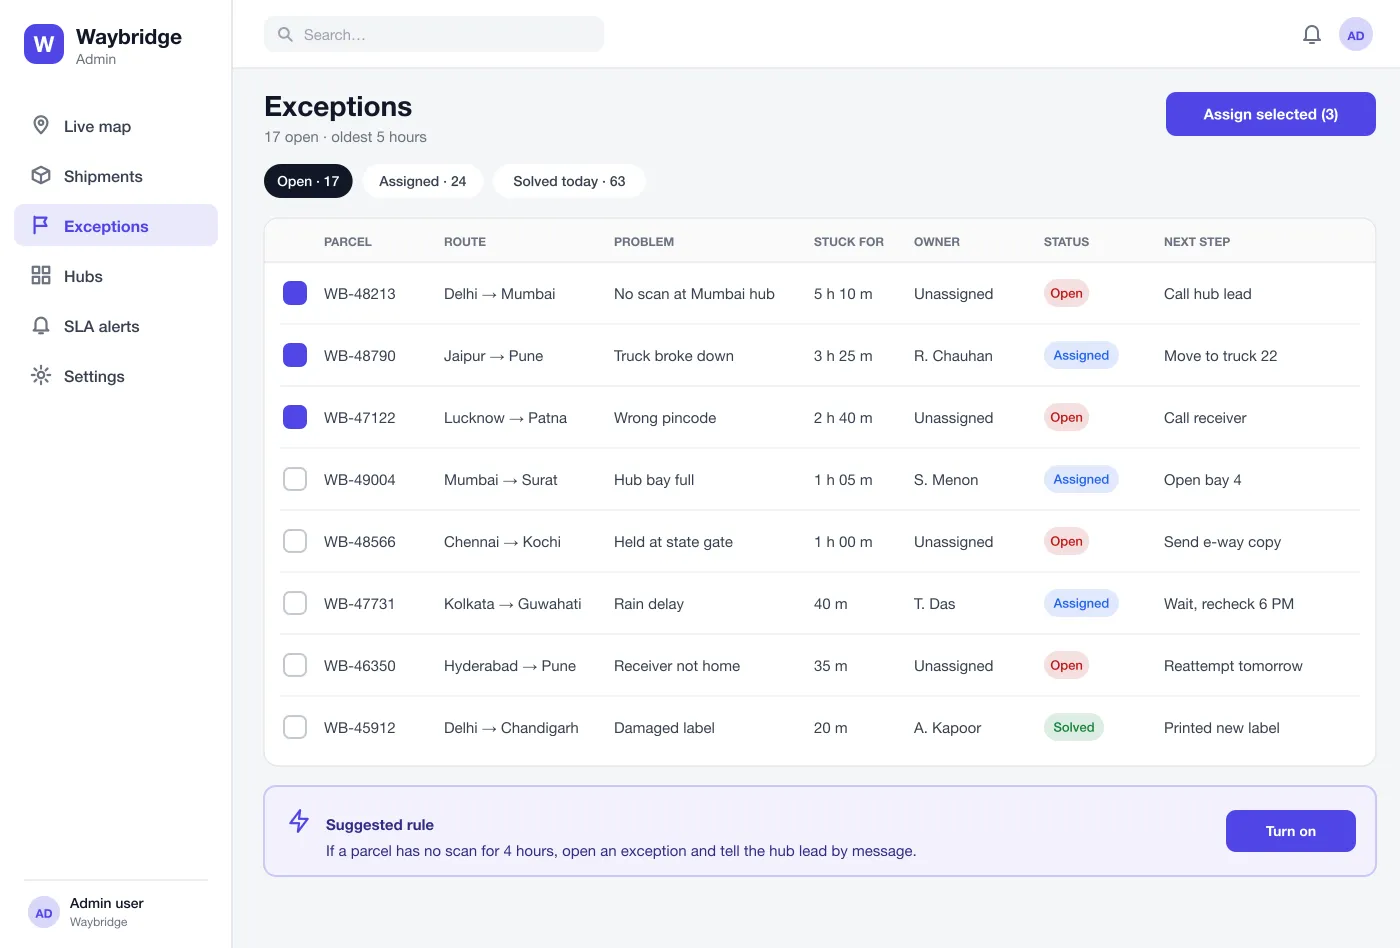
Exceptions

Stuck and late parcels come to the top with the problem, how long they have waited and who owns the fix. Pick several and hand them to one person.

Exceptions: stuck and delayed parcels, with a reason and who owns the fix
03 / 04

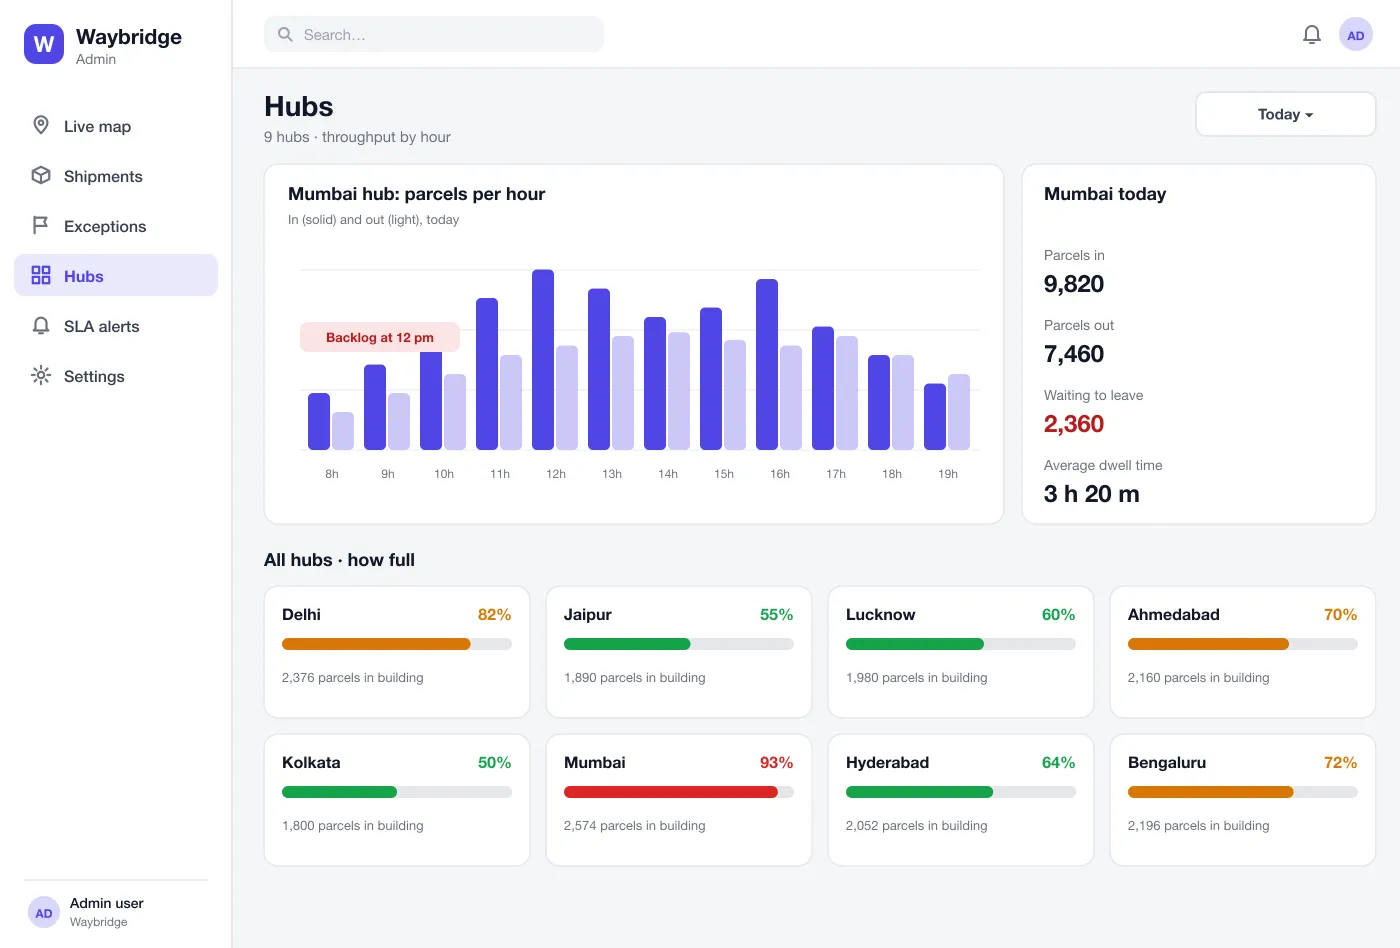
Hub throughput

An hourly chart of parcels in and out for each hub. A growing gap between the bars is a backlog you can see before it blocks the floor.

Hub throughput: parcels in and out each hour, and how full each hub is
04 / 04

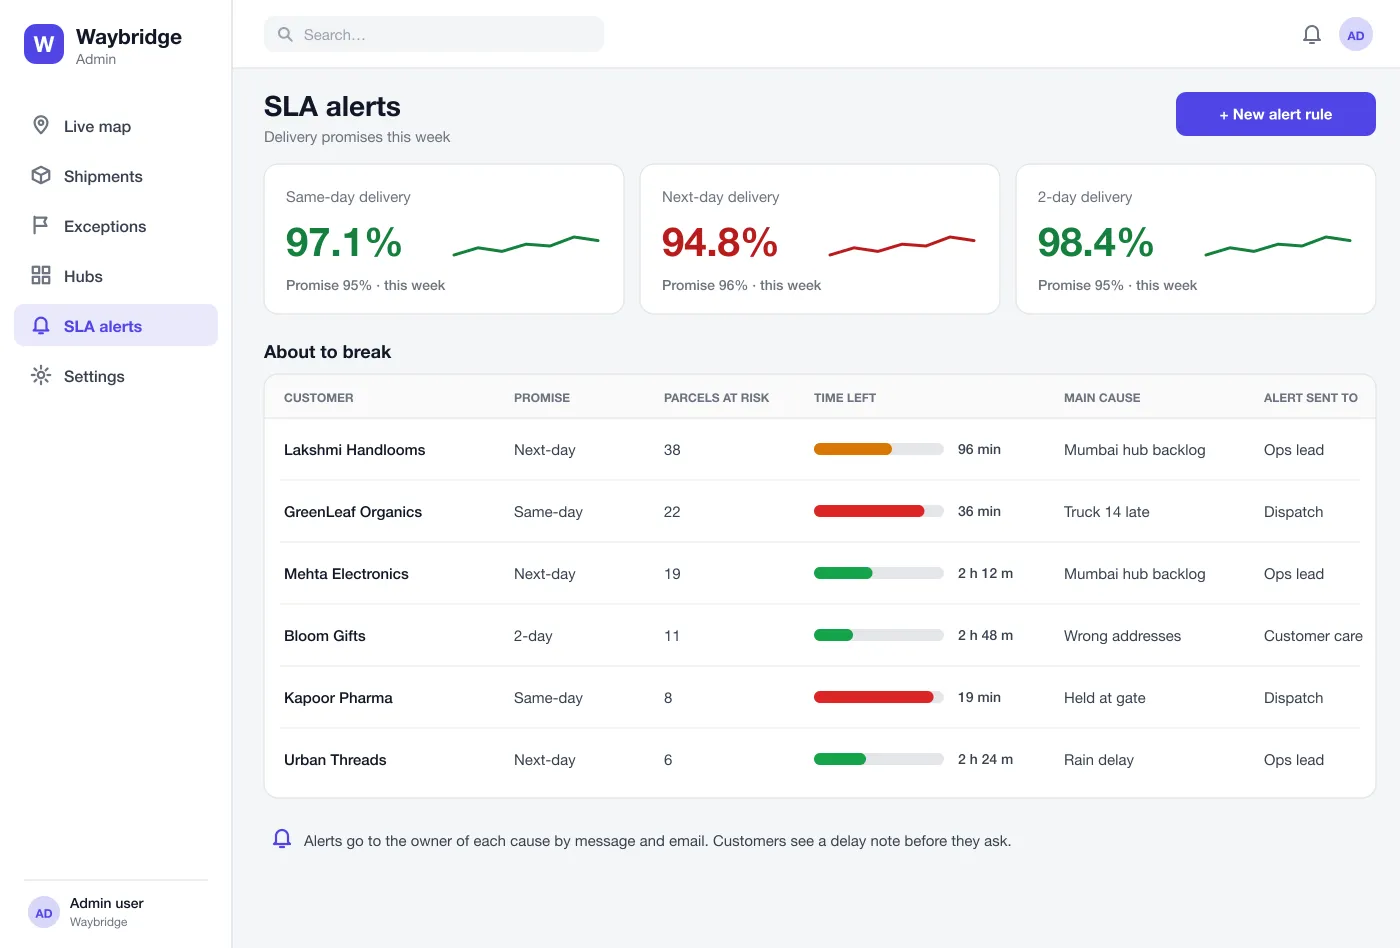
SLA alerts

For every customer promise, see how many parcels are at risk and how much time is left, sorted so the closest misses come first.

SLA alerts: promises that are about to break, sorted by customer
Features

What the tower watches for you

Live map

Hubs sit on a map as circles coloured by how full they are. Moving parcels show as dots on the lanes between hubs, and a side list shows what needs a look first.

Exception queue

Any parcel that breaks a rule lands here with the problem, how long it has been stuck and a suggested next step. A manager can pick several and give them to one person.

Rules that raise exceptions

The team sets simple rules, such as no scan for four hours. The tower suggests rules and the manager turns them on with one tap.

Hub throughput

Each hub has an hourly chart of parcels coming in and going out. A backlog shows up as a gap between the two bars, so it is easy to spot.

Hub load board

A card for every hub shows how many parcels are in the building against what it can hold. Red cards show where to send help.

SLA alerts

For each customer and promise, the tower shows how many parcels are at risk and how long is left. Alerts go to the person who owns the cause.

How it works

A day in the operations room

  1. Start the day

    The manager opens the live map, checks which hubs are red and reads the list of parcels that need a look.

  2. Clear a stuck parcel

    The manager opens the exception, sees it has had no scan for five hours, assigns it to the hub lead and adds a note.

  3. Relieve a full hub

    Throughput shows Mumbai taking in more than it sends out. The team moves some parcels to a quieter hub and the card turns amber.

  4. Protect a promise

    An SLA alert shows 38 next-day parcels at risk for one customer. Customer care sends a delay note before the customer asks.

Roles

One tower, three seats

Operations managers

Check the map, clear the exception list and move work between hubs.

Hub leads

See how full your hub is and which parcels need a look first.

Customer care

Send a delay note before the customer asks.

FAQ

Questions from operations teams

What is a logistics control tower?

It is one screen that shows the whole delivery network. It shows where parcels are, what is going wrong and which hub needs help, so the team can act early instead of waiting for complaints.

Which systems does a control tower connect to?

Usually the hub scanning system, the driver app, partner carrier feeds and the order system that holds each delivery promise. Each one sends scan events through an API or a file drop.

Can you build a parcel logistics control tower like this for my business?

Yes. We can build a control tower that reads scans from your hubs, drivers and partners, and shows them on one live screen with alerts for your own delivery promises.

What data does it need?

It needs scan events from hubs, trucks and delivery apps, plus the delivery promise for each customer. Without scans it cannot know where a parcel is.

How does it find a stuck parcel?

You set rules, for example: no scan for 4 hours. When a parcel breaks a rule, it moves to the exceptions list with a reason and an owner.

Who are the users?

The design has three roles: network managers who watch the map, hub leads who clear their own exceptions, and customer care who see delays for the customers they handle.
See Waybridge in action

Walk through the live map, the exception list and the alerts.

See the screens →