Portfolio overview
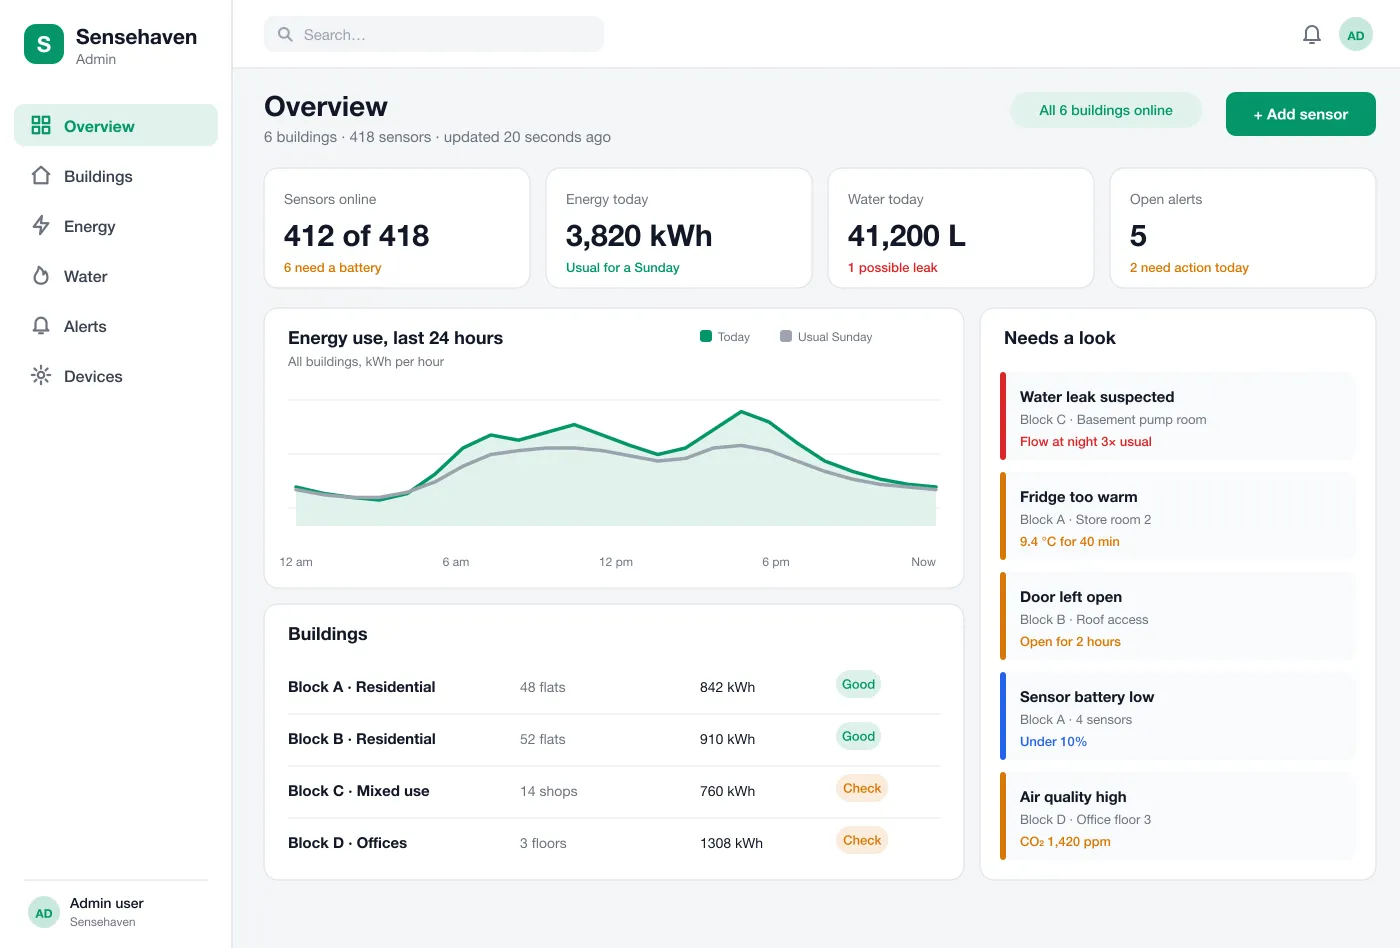
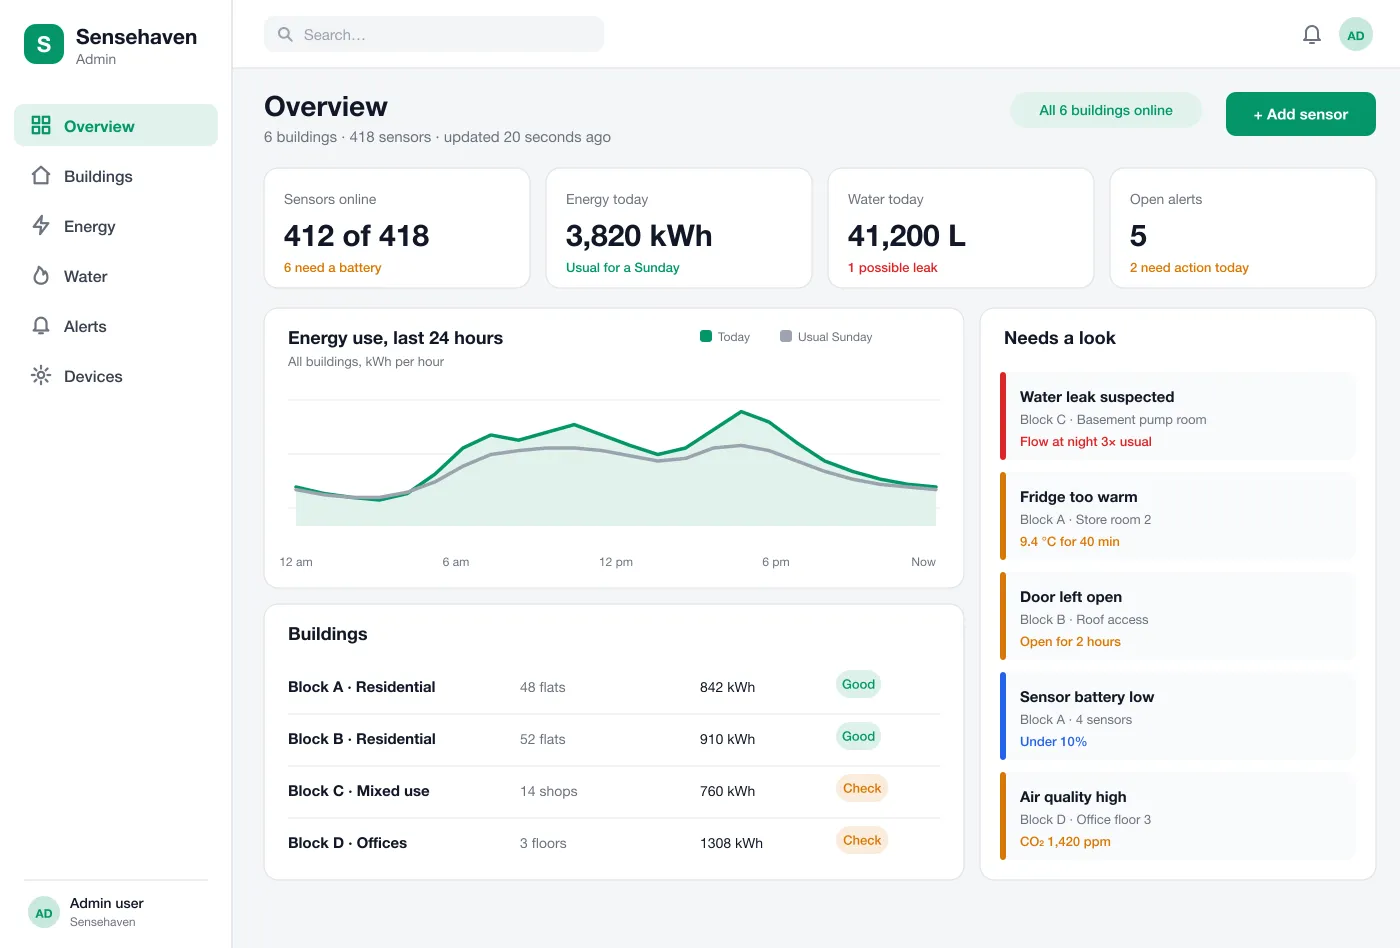
The first page shows how many sensors are online, today's energy and water use, a 24-hour chart against a usual day, and a short list of things that need a look.
Sensehaven is a dashboard that watches buildings through sensors, designed and built by our team. It shows energy, water, temperature and doors on one page, and sends an alert when a reading goes wrong, such as a leak or a warm fridge.
Sensehaven was designed and built by the PRS CloudTech team.
The brief
Property teams look after many buildings with very few people. A leaking pipe, a fridge that has stopped cooling or a door left open all over the weekend can cost a lot before anyone notices.
Many buildings already have sensors, but each kind comes with its own app. The electricity meter has one login, the water tank another, the temperature loggers a third. Nobody has the whole picture.
One page for every building
Energy, water, temperature and doors should sit together, so the team does not hop between apps.
Warnings that mean something
Alerts should say what is wrong and where, and go to the person who can fix it.
A view of the building
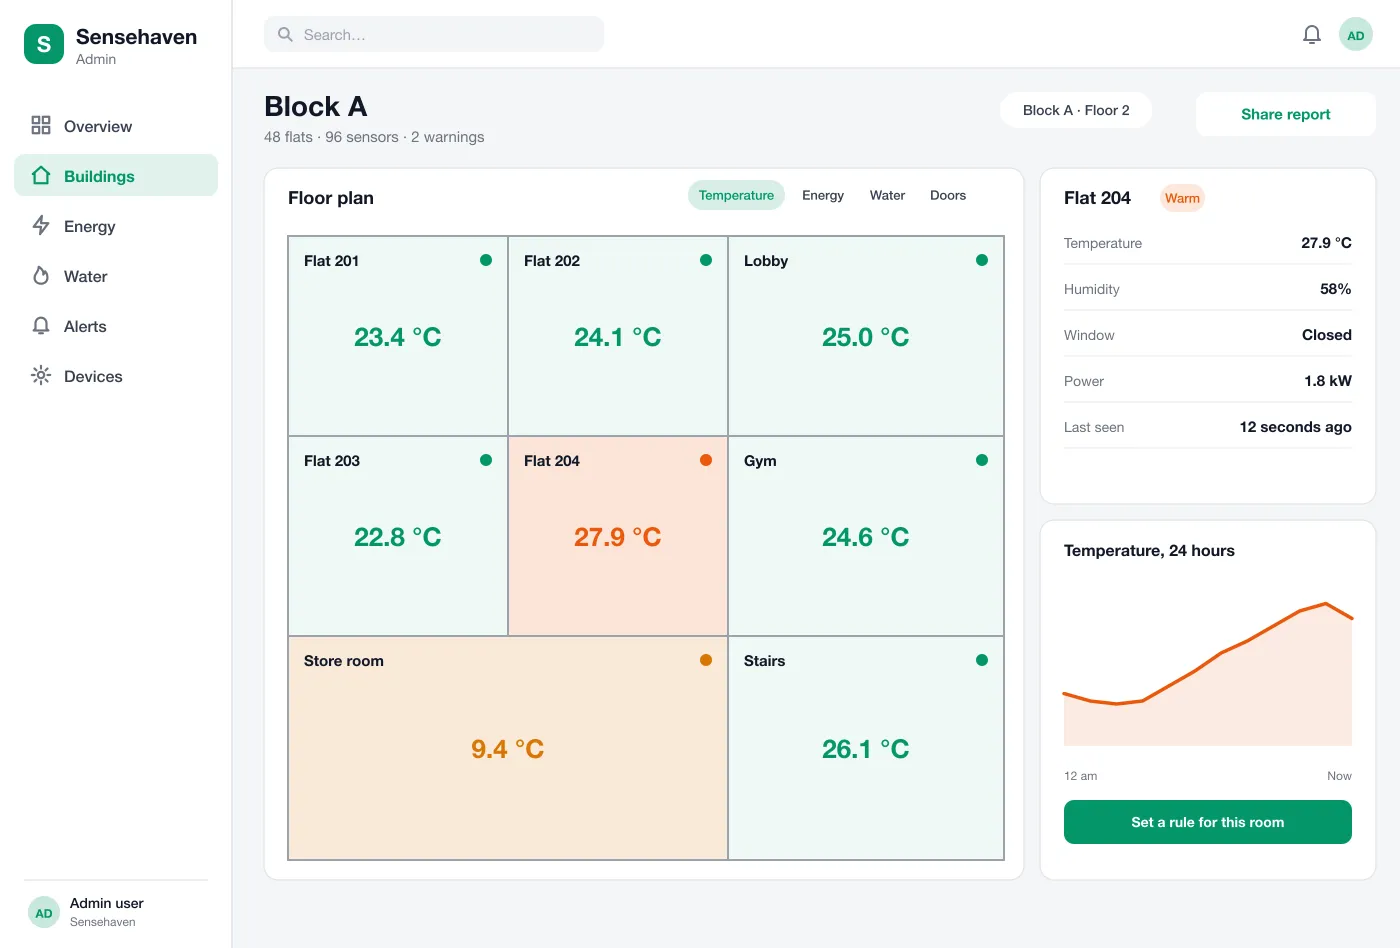
Readings are easier to read on a floor plan than in a long list of device names.
Reports for owners
Managers need monthly use and cost by building, and a simple way to share them.
What we designed
These are the main parts of Sensehaven.
The first page shows how many sensors are online, today's energy and water use, a 24-hour chart against a usual day, and a short list of things that need a look.
Each building has floor plans with a reading in every room. Rooms change colour when a value is outside its normal range, and a click opens that room's details.
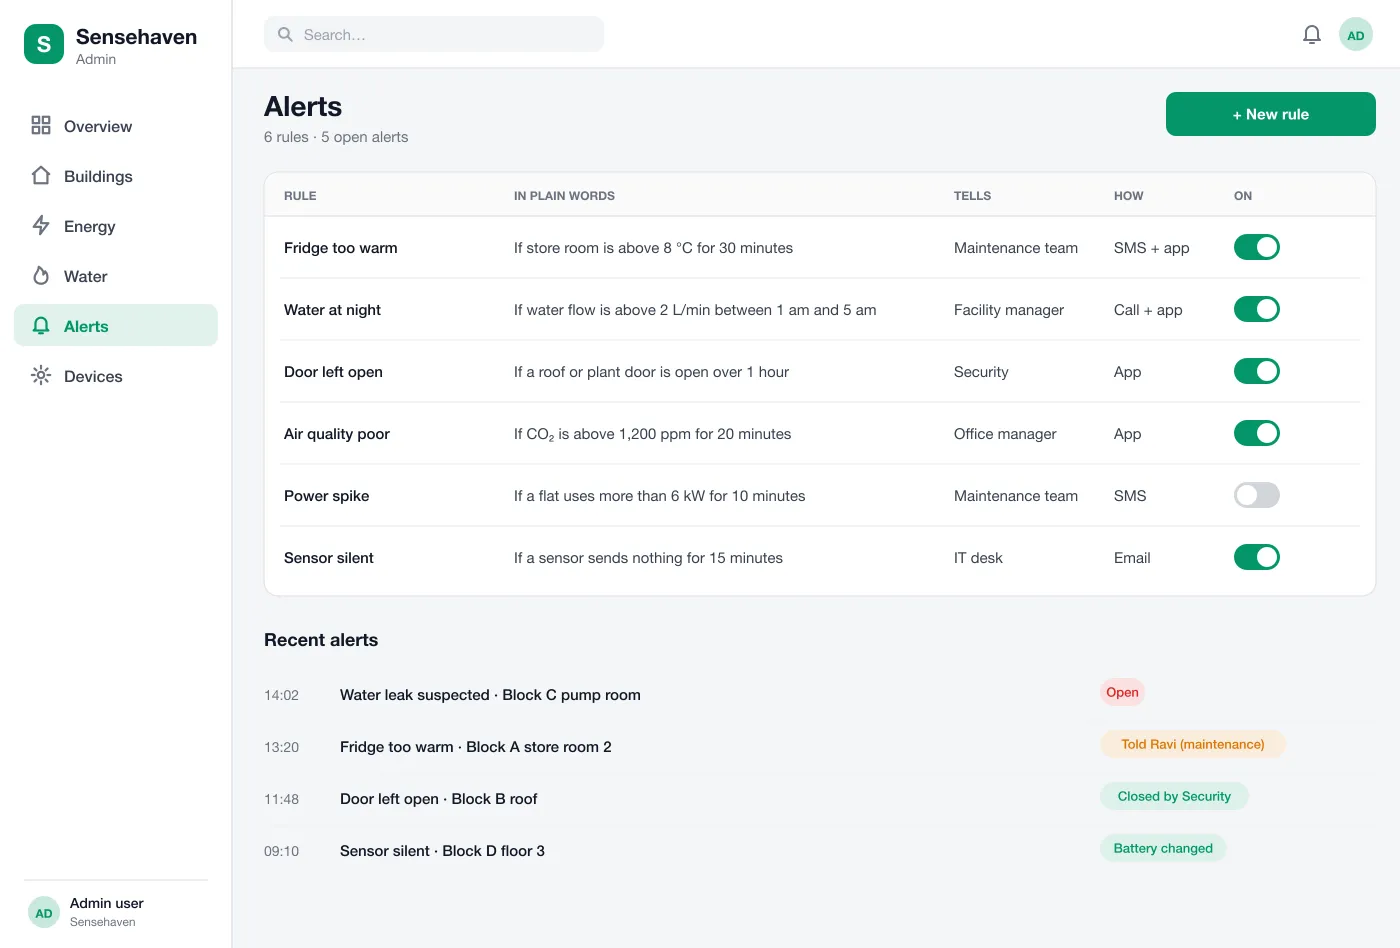
A rule is written like a sentence: if the store room is above 8 degrees for 30 minutes, tell the maintenance team by SMS. Rules can be switched on and off.
Each rule names a person or a team and a way to reach them, such as the app, SMS, email or a phone call. Alerts that nobody opens can be passed to a second person.
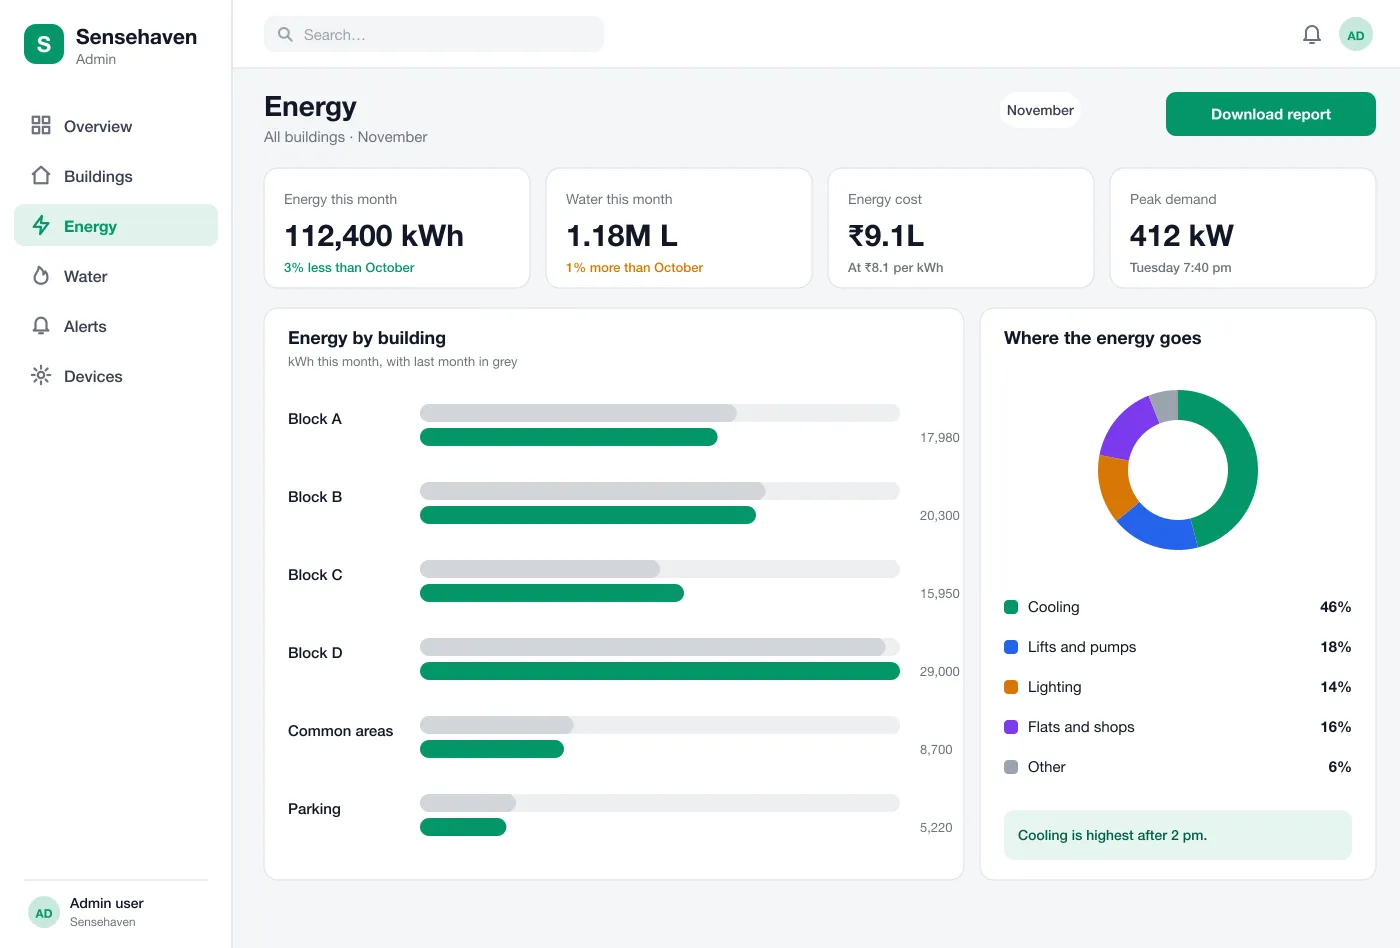
The report compares this month with the last, by building and by use, such as cooling, lifts or lighting. It can be downloaded as a file for owners.
The dashboard also watches the sensors themselves. It lists those that have gone silent or have low batteries, so gaps in the data are fixed early.
Screens
How it works
Here is how the main tasks work in Sensehaven, from the first alert to the monthly report.
Catch a leak
Water flow in the pump room is high at night. An alert goes to the facility manager, who opens the building page and finds the room.
Keep food safe
A store room fridge gets too warm. The maintenance team is texted and marks the alert as handled once the fridge is fixed.
Write a new rule
A manager picks a room, types the limit and chooses who is told. The rule is live in a minute.
Report to the owner
At month end the manager opens the report, checks energy by building and downloads it to send on.
Suggested technology
What we would deliver
FAQ
It is a web page that shows readings from small sensors placed around a building. The sensors measure things like power, water flow, temperature and open doors. The dashboard collects the readings and warns the team when something looks wrong.
It can read most meters and sensors that send data over MQTT, Modbus, LoRaWAN gateways or a vendor cloud API. We list the devices in your buildings first, then add a small connector for each type so all readings land in one place.
Yes. We can build the dashboard, connect the sensors you already use or help you choose some, and set up alerts by app, SMS, call or email.
The manager writes a rule in plain words, such as a fridge above 8 degrees for 30 minutes. When a reading breaks the rule, the right person is told in the way they choose.
Yes. The dashboard keeps the readings and shows them by day, month and building, so the team can see what changed and download a report.
Tell us who will use it and what it must do. We will reply with a plan, a timeline and a price.