Test booking
Riders choose a test, such as a 20 minute FTP test, a ramp test or a short sprint, and book a slot. The lab sees the bike, the room and the coach for each slot.
Cadencelab is a cycling test lab platform designed and built by our team. Riders book FTP and lab tests, see live power during the test, and get results and training zones. Coaches track every rider and send a report in plain words.
Cadencelab was designed and built by the PRS CloudTech team.
The brief
Cyclists train by numbers. To train well, they need to know how much power they can hold, and that comes from a proper test in a lab or on a trainer.
Many labs still note results on paper or in spreadsheets. The rider gets a PDF days later and has to work out the training zones alone. The coach cannot easily compare this test with the one from three months ago.
Easy booking
Riders should pick a test and a time, and the lab should know which bike and coach are needed.
A clear test screen
During a hard effort, the rider needs big numbers and the coach needs to see the same data.
Results that make sense
A rider wants one new number and the zones to train in, not a page of figures.
History over time
Coaches need every test for each rider to see if training is working.
What we designed
These are the six main parts of Cadencelab.
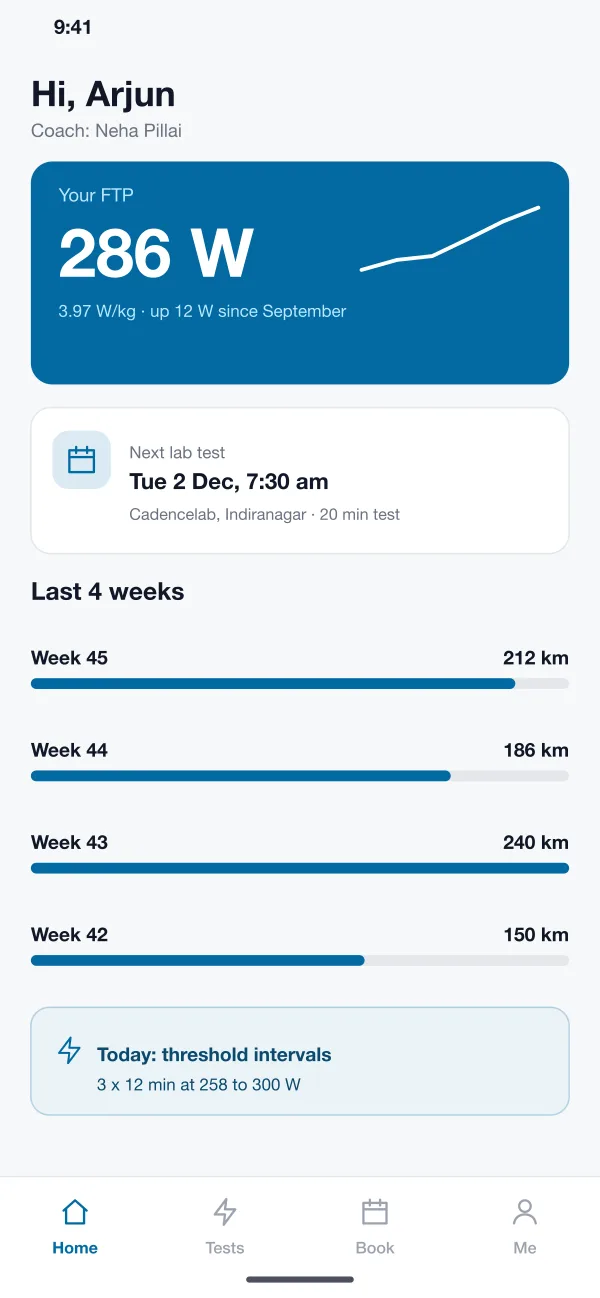
Riders choose a test, such as a 20 minute FTP test, a ramp test or a short sprint, and book a slot. The lab sees the bike, the room and the coach for each slot.
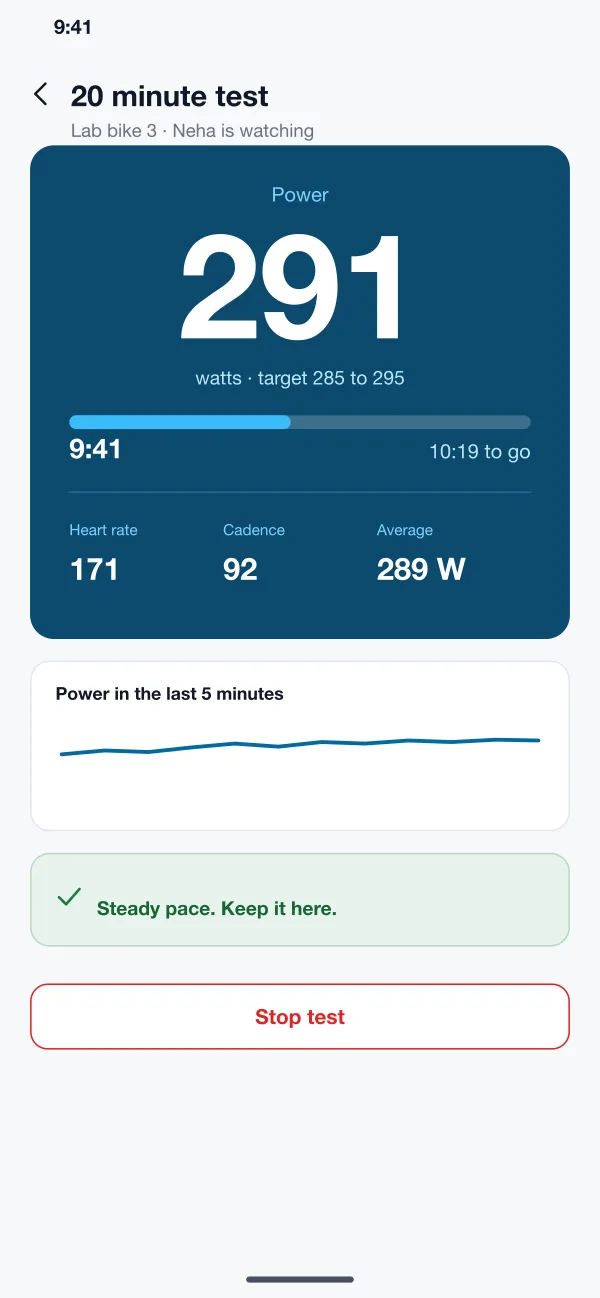
The app links to the power meter. During the test, the rider sees power, heart rate, cadence and time left, with a target range. A simple note tells them to hold, ease or push.
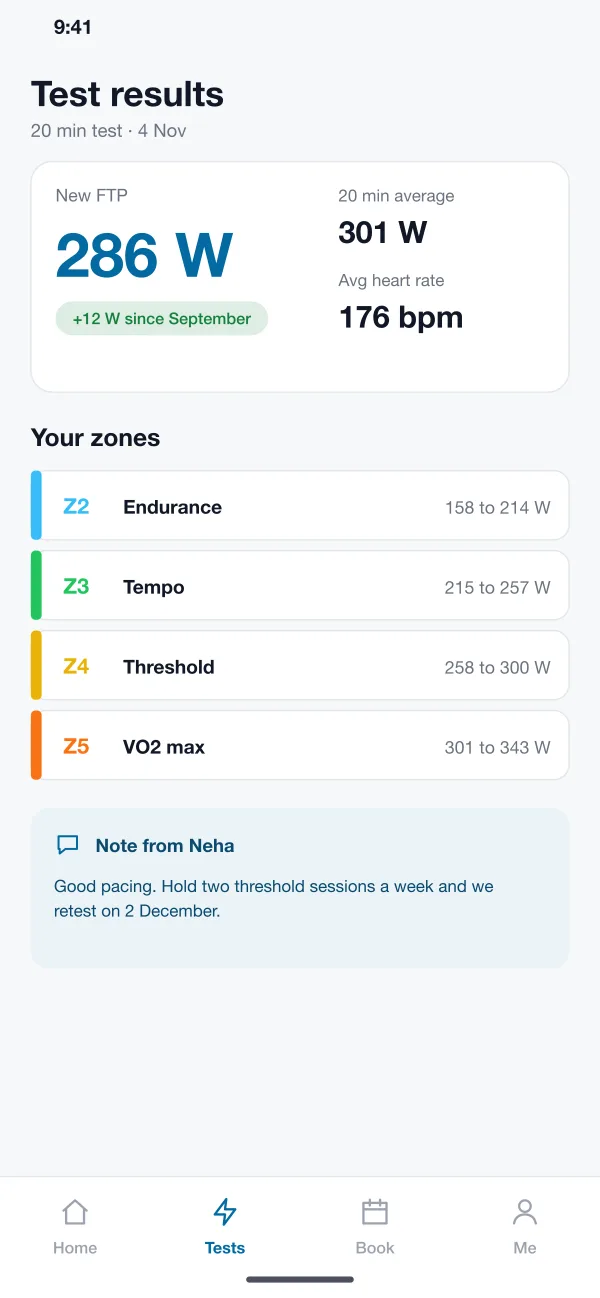
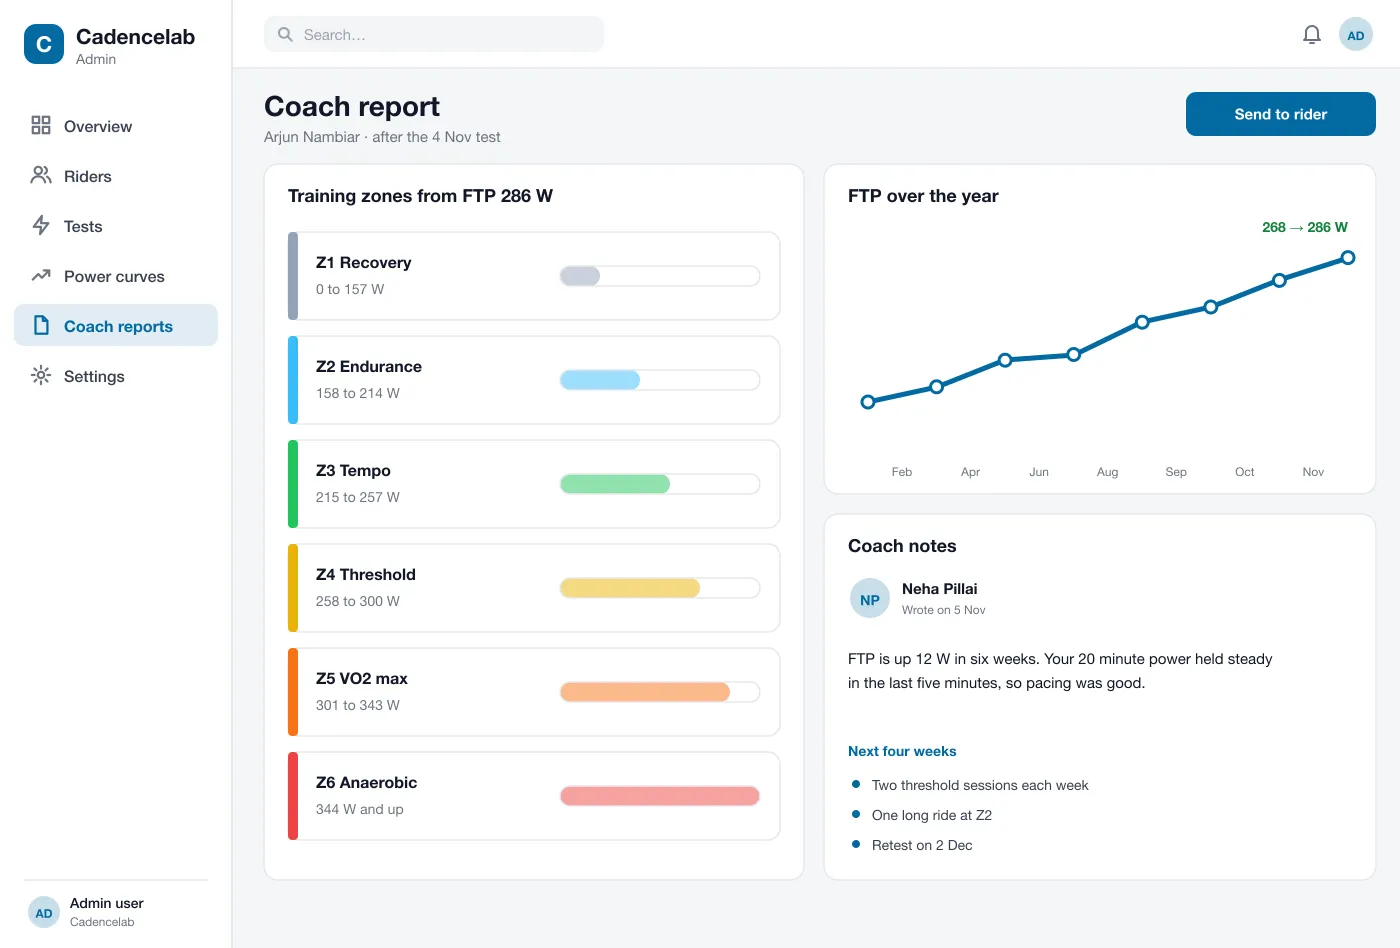
When the test ends, the app shows the new FTP, the average power and heart rate, and the six training zones as watt ranges.
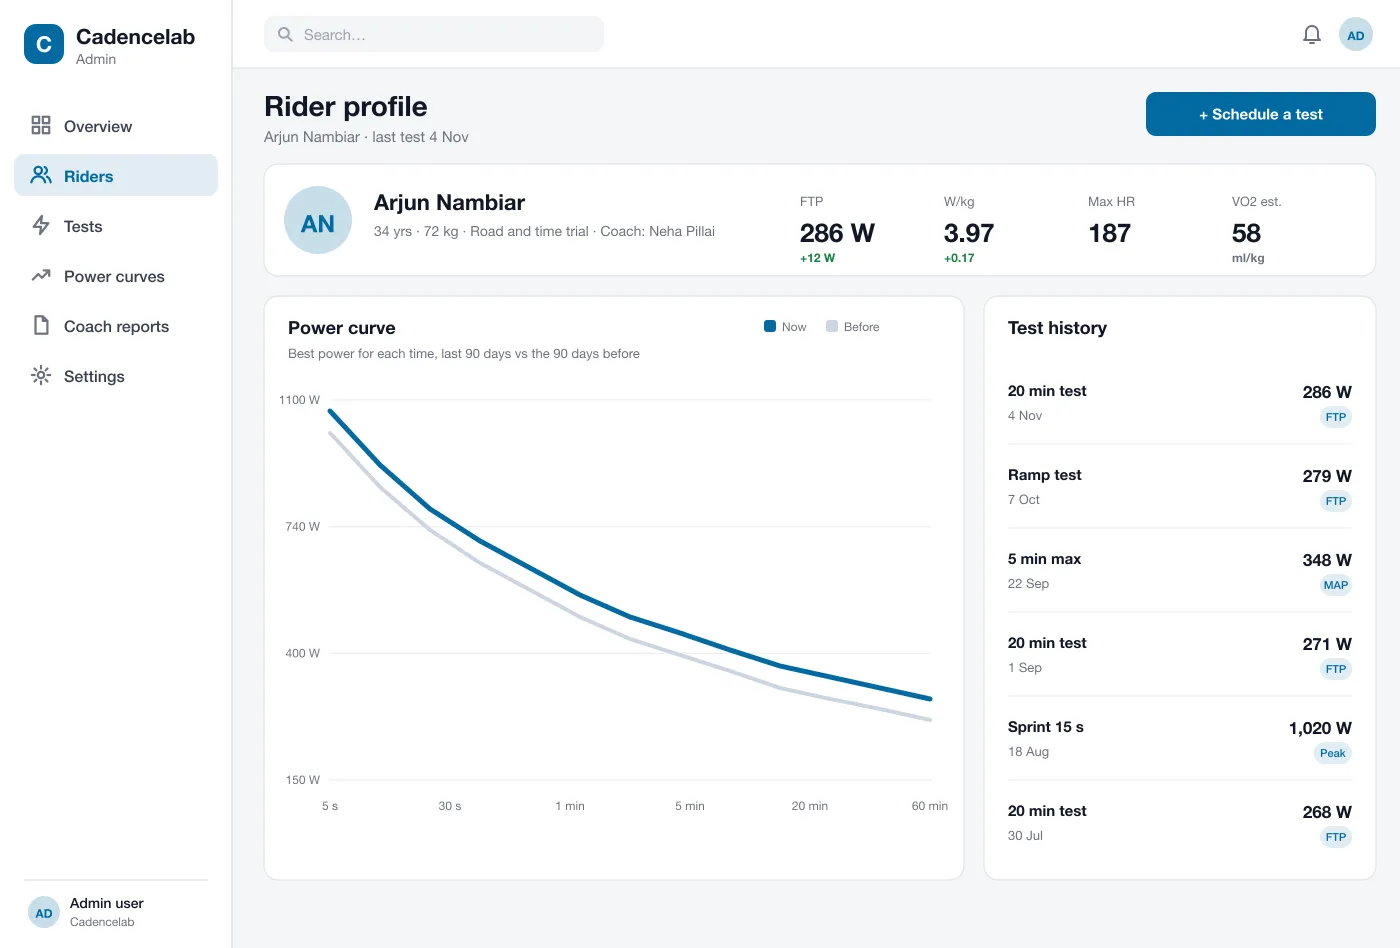
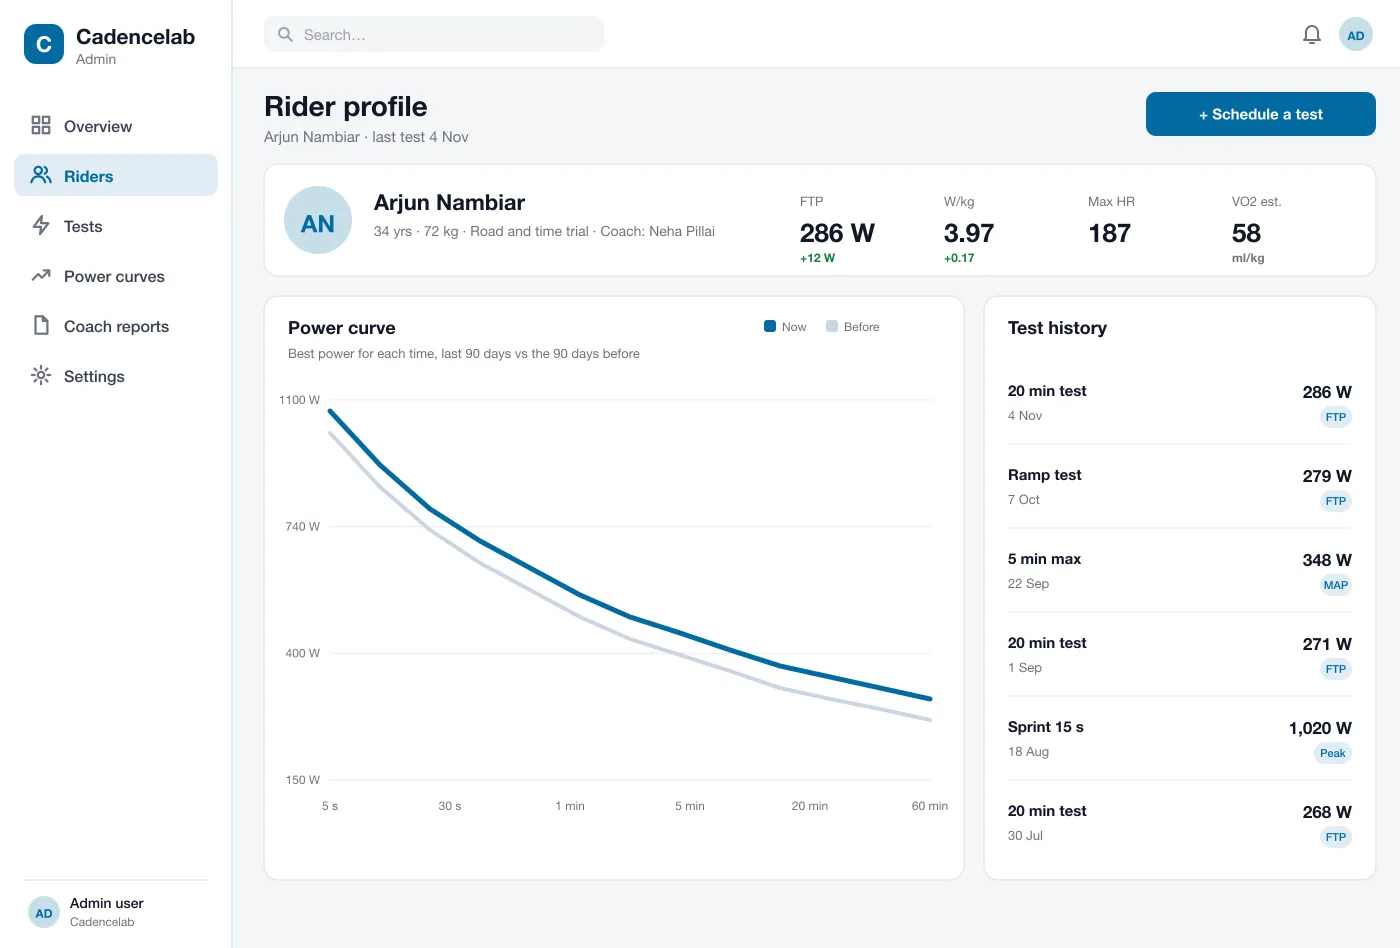
Each rider has a page with weight, FTP, power per kilo and every past test. The coach can see at a glance who has improved.
A chart shows the best power a rider has held for each length of time, from a few seconds to an hour. Two curves can be placed together to compare the last three months with the three before.
After a test, the coach writes a short note and a plan for the next few weeks. The rider reads it in the app, and the retest date is set.
Screens
The mobile app
How it works
Here is how the main tasks work, from booking a test to the next training block.
Book a test
The rider picks a test and a time. The lab confirms the bike and coach, and the rider gets a reminder the day before.
Take the test
The rider pairs the power meter, starts the test and follows the live screen while the coach watches the same numbers.
Read the results
The rider sees the new FTP and zones straight away and reads the coach's note in plain words.
Plan the next block
The coach checks the power curve and history, adjusts the plan and sets the date of the next test.
Suggested technology
What we would deliver
FAQ
FTP means functional threshold power. It is the most power a rider can hold for about an hour. A common way to find it is a hard 20 minute effort. Coaches use it to set training zones.
Most power meters, smart trainers and heart rate straps use Bluetooth or ANT+, and the app can read them directly. Results can also be imported from files or synced with training apps the rider already uses.
Yes. We can build the coach dashboard and the rider app for Android and iOS, and connect them to the power meters and lab bikes you use.
The app links to the power meter or smart trainer over Bluetooth. The rider and the coach both see the same live numbers while the test runs.
Yes. The coach opens a rider profile with the latest test, power curve and history, and writes a report that the rider can read in the app.
Tell us who will use it and what it must do. We will reply with a plan, a timeline and a price.